For the video processing activity, we chose to verify the dependence of the motion of a rolling cylinder on the angle of incline of the ramp it is on. We took multiple takes of the rolling cylinder for different inclination angles. In the next figure, I show frames extracted from the video and their corresponding results from image segmentation.


Figure 1. (top four) Frames taken from the video. The rolling cylinder is seen to be at different parts of the ramp. (bottom) The corresponding results of image segmentation of the rolling cylinder.
Knowing the dimensions of the ramp, I use dimensional analysis to convert the pixel distance to actual distance. And knowing the frame rate of the camera and the total number of frames, I can calculate the sampling time. Using each segmented image, I take the average of the x and y position of each pixel with a HIGH state to simulate a point mass in motion. The next figure will show the displacement vs. time plot for different heights (inclination angle).
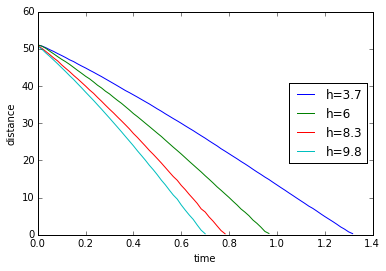
Figure 2. A plot of the measured distance covered by the rolling cylinder. Distance is in units of cm.
We expect that the cylinder will fall faster at a higher inclination height which is shown by h=9.8cm. Due to gravitational acceleration, we also expect a concave downward parabolic behavior for distance. Calculating for the derivative by taking the point-by-point difference, I get the following plots for velocity and acceleration.
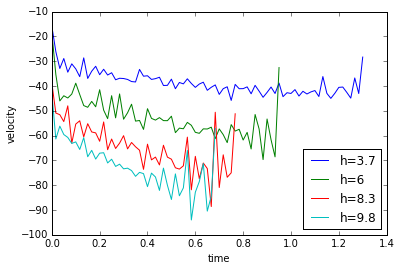
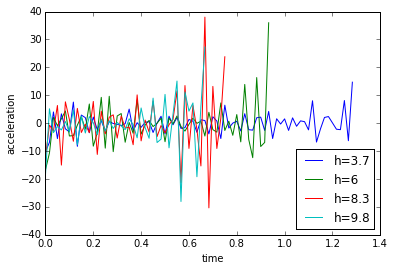
Figure 3. (top) Plot of the velocity of the rolling cylinder and (bottom) plot of the translational acceleration of the rolling cylinder.
The calculated data is noisy but qualitatively we can say that the velocity is linear and sloping downwards while the mean of the acceleration is almost constant, which is the expected output. Better results might be calculated by fitting a line in the velocity data and taking its slope to get the acceleration.
For this activity I will give myself a score of 8 for bad quality of the presented data. For this activity, I acknowledge Ron-sama for helping me with the video parsing and the segmentation. Here is the python code I used for the activity.
# -*- coding: utf-8 -*-
“””
Created on Mon Nov 30 14:12:26 2015
@author: jesli
“””
from __future__ import division
import numpy as np
import matplotlib.pyplot as plt
import matplotlib.cm as cm
import Image as im
fps=60.
t1=np.arange(0,80/fps,1/fps).tolist()
t2=np.arange(0,59/fps,1/fps).tolist()
t3=np.arange(0,48/fps,1/fps).tolist()
t4=np.arange(0,43/fps,1/fps).tolist()
conv=0.0502
#plank width = 16.3
#0.0502cm/pixel conversion
ht=[3.7,6,8.3,9.8]
theta=np.arctan(np.array(ht)/109)
number_1=(np.asarray(range(80))+120).tolist()
number_2=(np.asarray(range(59))+97).tolist()
number_3=(np.asarray(range(48))+98).tolist()
number_4=(np.asarray(range(43))+127).tolist()
ys_overlay=[]
for h in ht:
ys=[]
vs=[]
if h==3.7:
for number in number_1:
filename=”h=”+str(h)+”/segmented”+str(number)+”.jpg”
cap=np.asarray(im.open(filename))
[x_obj,y_obj]=np.where(cap==255)
y_ave=np.average(y_obj)
ys.append(y_ave)
# if
if h==6:
for number in number_2:
filename=”h=”+str(h)+”/segmented”+str(number)+”.jpg”
cap=np.asarray(im.open(filename))
[x_obj,y_obj]=np.where(cap==255)
y_ave=np.average(y_obj)
ys.append(y_ave)
if h==8.3:
for number in number_3:
filename=”h=”+str(h)+”/segmented”+str(number)+”.jpg”
cap=np.asarray(im.open(filename))
[x_obj,y_obj]=np.where(cap==255)
y_ave=np.average(y_obj)
ys.append(y_ave)
if h==9.8:
for number in number_4:
filename=”h=”+str(h)+”/segmented”+str(number)+”.jpg”
cap=np.asarray(im.open(filename))
[x_obj,y_obj]=np.where(cap==255)
y_ave=np.average(y_obj)
ys.append(y_ave)
ys=np.asarray(ys)*conv
ys_overlay.append(ys)
#differentiate!
d1=[]
for i in range(len(ys_overlay)):
final=np.roll(ys_overlay[i],-1)
initial=np.asarray(ys_overlay[i])
diff=((final-initial)*60).tolist()
del diff[-1]
d1.append(diff)
plt.figure(1)
plt.plot(t1,ys_overlay[0],label=’h=3.7′)
plt.plot(t2,ys_overlay[1],label=’h=6′)
plt.plot(t3,ys_overlay[2],label=’h=8.3′)
plt.plot(t4,ys_overlay[3],label=’h=9.8′)
plt.xlabel(‘time’)
plt.ylabel(‘distance’)
plt.legend(loc=5)
del t1[-1]
del t2[-1]
del t3[-1]
del t4[-1]
#differentiate again!
d2=[]
for i in range(len(d1)):
final=np.roll(d1[i],-1)
initial=np.asarray(d1[i])
diff=((final-initial)).tolist()
del diff[-1]
d2.append(diff)
plt.figure(2)
plt.plot(t1,d1[0],label=’h=3.7′)
plt.plot(t2,d1[1],label=’h=6′)
plt.plot(t3,d1[2],label=’h=8.3′)
plt.plot(t4,d1[3],label=’h=9.8′)
plt.xlabel(‘time’)
plt.ylabel(‘velocity’)
plt.legend(loc=4)
plt.show()
del t1[-1]
del t2[-1]
del t3[-1]
del t4[-1]
#translate to g
all_ave=[]
for i in range(len(d2)):
ave=np.mean(d2[i])
all_ave.append(ave)
lst=d2[0]+d2[1]+d2[2]+d2[3]
ave=np.mean(lst)
#calc g
g=[]
for angle in theta:
G=ave/np.sin(angle)
g.append(G)
plt.figure(3)
plt.plot(t1,d2[0],label=’h=3.7′)
plt.plot(t2,d2[1],label=’h=6′)
plt.plot(t3,d2[2],label=’h=8.3′)
plt.plot(t4,d2[3],label=’h=9.8′)
plt.xlabel(‘time’)
plt.ylabel(‘acceleration’)
plt.legend(loc=4)
plt.show()
